Fig. 14
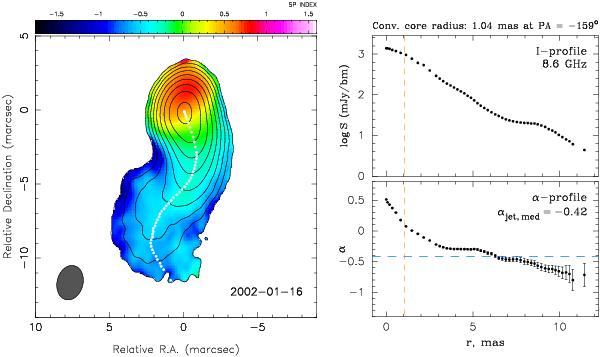
Spectral index distribution in J2202+4216 (left) calculated between 2.3 GHz and 8.6 GHz with the 8.6 GHz total intensity contours overlaid. White dots represent the total intensity ridge line, along which we plot the profiles of total intensity (top right) and spectral index (bottom right). The lowest contour is plotted at 0.18% of the peak brightness of 1395 mJy beam-1. The shaded ellipse represents the FWHM of the restoring beam of 2.34 × 1.74 mas at PA =+−14.0°, derived as the average between the corresponding interferometric restoring beams at 2.3 GHz and 8.6 GHz. The vertical orange dashed line shows the convolved radius of the VLBI core calculated along the inner jet direction.
Current usage metrics show cumulative count of Article Views (full-text article views including HTML views, PDF and ePub downloads, according to the available data) and Abstracts Views on Vision4Press platform.
Data correspond to usage on the plateform after 2015. The current usage metrics is available 48-96 hours after online publication and is updated daily on week days.
Initial download of the metrics may take a while.