Free Access
Fig. 5
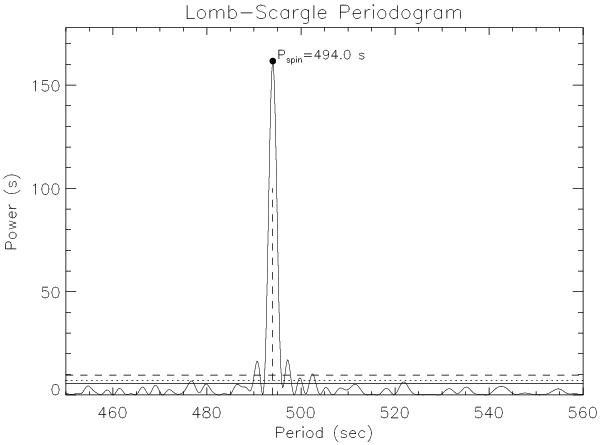
Lomb-Scargle periodogram of the 0.3−8 keV band light curve of 1RXS J180431.1−273932 with the indication of the detected periodicity. The solid, dotted, and dashed horizontal lines represent the 68%, 90%, and 99% confidence levels resulted from the Monte Carlo simulations (see text for details).
Current usage metrics show cumulative count of Article Views (full-text article views including HTML views, PDF and ePub downloads, according to the available data) and Abstracts Views on Vision4Press platform.
Data correspond to usage on the plateform after 2015. The current usage metrics is available 48-96 hours after online publication and is updated daily on week days.
Initial download of the metrics may take a while.