Fig. 4
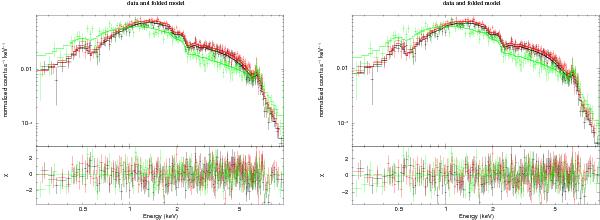
XMM-Newton X-ray spectra of 1RXS J180431.1−273932 and associated best fit lines superimposed for the phenomenological model (left) and the physical model (right). See text for details of the two models. Residuals are reported at the bottom of each panel. Red and black data points refer to MOS 1 and MOS 2, respectively. Green data points are those of the pn camera. (This figure is available in color in the electronic form.)
Current usage metrics show cumulative count of Article Views (full-text article views including HTML views, PDF and ePub downloads, according to the available data) and Abstracts Views on Vision4Press platform.
Data correspond to usage on the plateform after 2015. The current usage metrics is available 48-96 hours after online publication and is updated daily on week days.
Initial download of the metrics may take a while.