Fig. 5
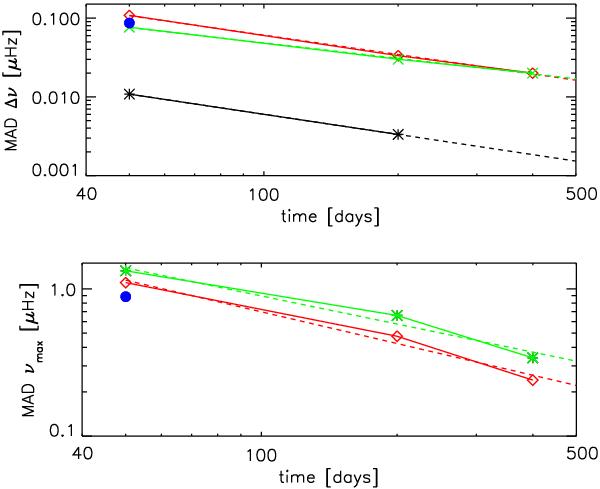
Median absolute deviations (MAD) observed for ⟨ Δν ⟩ (top) and νmax (bottom) for the different methods as a function of the timespan of the dataset. Colour coding the same as in Fig. 3 with red for OCT, green for COR:EACF, black for COR:UP and blue for CAN. The 400 day results of COR:UP agree with the 600 day results and hence the MAD is 0.000 and not shown. The dashed lines indicate linear fits through the data (with same colour-coding) in log-scale. See text for further details.
Current usage metrics show cumulative count of Article Views (full-text article views including HTML views, PDF and ePub downloads, according to the available data) and Abstracts Views on Vision4Press platform.
Data correspond to usage on the plateform after 2015. The current usage metrics is available 48-96 hours after online publication and is updated daily on week days.
Initial download of the metrics may take a while.