Fig. 2
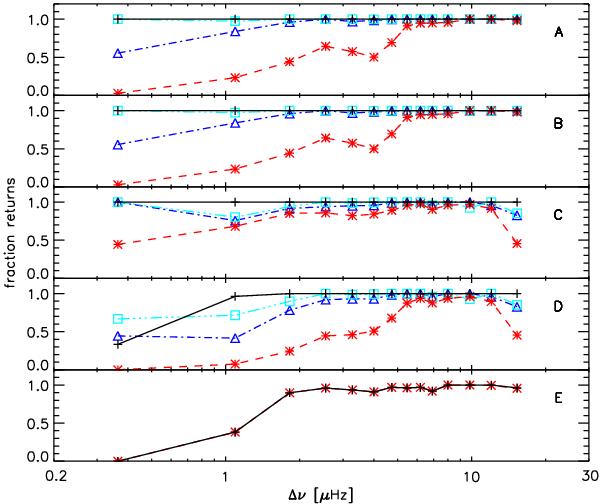
Fraction of runs with returned values for each star per Δν interval. Each panel shows the results of a certain method (A: COR – Universal Pattern, B: COR – EACF, C: OCT – PS ⊗ PS, D: OCT – PS ⊗ PS (Bayesian), E: CAN) with run length 50, 200, 400, 600 days in red, blue, cyan and black, respectively. Note that the 50 and 600 day curves in panel E overlap due to the fact that the 600 day results were used to constrain the input for the 50 day runs. No results for 200 and 400 day long runs were obtained by CAN.
Current usage metrics show cumulative count of Article Views (full-text article views including HTML views, PDF and ePub downloads, according to the available data) and Abstracts Views on Vision4Press platform.
Data correspond to usage on the plateform after 2015. The current usage metrics is available 48-96 hours after online publication and is updated daily on week days.
Initial download of the metrics may take a while.