Fig. 3
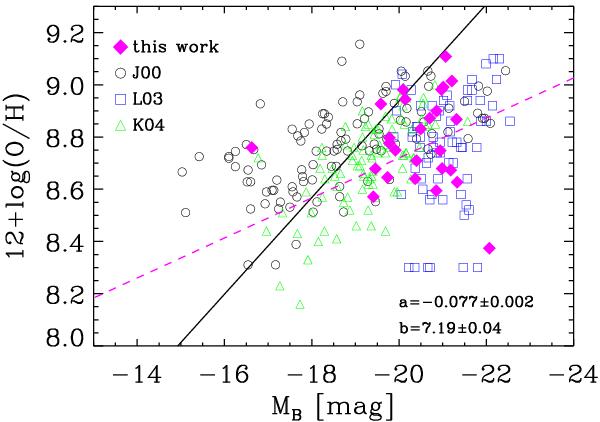
Plot of our data (solid diamonds) on the L − Z plane. Open squares represent the galaxies in the redshift range 0.47 < z < 0.92 from the Canada-France Redshift Survey (Lilly et al. 2003), open triangles mark the galaxies with 0.3 < z < 0.6 from the GOODS-North Field (Kobulnicky & Kewley 2004), and open circles refer to the local galaxies of the Nearby Field Galaxy Sample (Jansen et al. 2000). The solid line indicates the L − Z relation obtained by Tremonti et al. (2004) for local galaxies. The magenta dashed line represents the linear fit (12 + log (O/H)= aMB + b) through our data points except for J154925.24-003717.8 and J003806.59+000421.9.
Current usage metrics show cumulative count of Article Views (full-text article views including HTML views, PDF and ePub downloads, according to the available data) and Abstracts Views on Vision4Press platform.
Data correspond to usage on the plateform after 2015. The current usage metrics is available 48-96 hours after online publication and is updated daily on week days.
Initial download of the metrics may take a while.