Free Access
Fig. 2
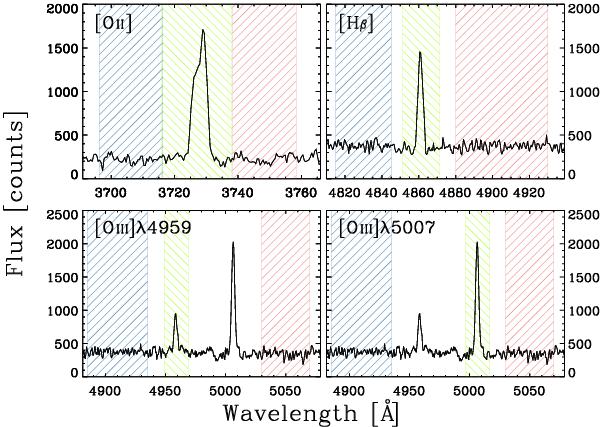
Central (green dashed region) and continuum bandpasses (blue and red dashed regions) adopted for measuring the equivalent widths of the [O ii]λ3727 (top left panel), Hβ (top right panel), [O iii]λ4959 (bottom left panel), and [O iii]λ5007 (bottom right panel) emission lines.
Current usage metrics show cumulative count of Article Views (full-text article views including HTML views, PDF and ePub downloads, according to the available data) and Abstracts Views on Vision4Press platform.
Data correspond to usage on the plateform after 2015. The current usage metrics is available 48-96 hours after online publication and is updated daily on week days.
Initial download of the metrics may take a while.