Fig. 8
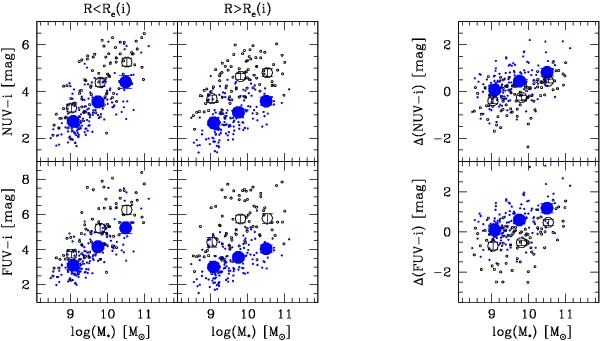
The inner (left) and outer (right) NUV-i (top) and FUV-i (bottom) colour vs. stellar mass. Symbols are as in Fig. 4. The right-most panel shows the inner-outer NUV-i (top) and FUV-i (bottom) colour difference as a function of stellar mass. The large circles show the averages for each sub-sample in different bins of stellar mass.
Current usage metrics show cumulative count of Article Views (full-text article views including HTML views, PDF and ePub downloads, according to the available data) and Abstracts Views on Vision4Press platform.
Data correspond to usage on the plateform after 2015. The current usage metrics is available 48-96 hours after online publication and is updated daily on week days.
Initial download of the metrics may take a while.