Fig. 2
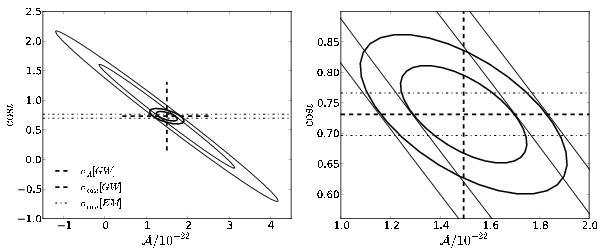
Left: two-dimensional error ellipses of  and cosι extracted from the variance-covariance matrix,
  , for AM CVn. The two thin black lines represent 1-σ and 2-σ ellipses and the black dashed lines represent the 1-σ GW errors in and cosι with the cross at the true value of the parameters. The unphysical values (i.e. negative numbers along the amplitude axis) are caused by the Gaussian tails of the parameter uncertainty about their true values. The right panel is a zoom of the area that is constrained by the 1-σ EM error of 4° shown in dash-dotted lines. The 1-σ GW standard deviation in decreases from ~1.08 × 10⁻²² to ~0.165 × 10⁻²², roughly a factor of 6.5. The corresponding error ellipses for the reduced PDF are shown as thick black ellipses for 1-σ and 2-σ.
Current usage metrics show cumulative count of Article Views (full-text article views including HTML views, PDF and ePub downloads, according to the available data) and Abstracts Views on Vision4Press platform.
Data correspond to usage on the plateform after 2015. The current usage metrics is available 48-96 hours after online publication and is updated daily on week days.
Initial download of the metrics may take a while.