Free Access
Fig. 4
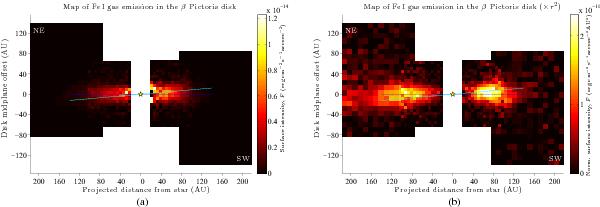
Map of Fe i emission, multiplied with the projected distance to the star squared in panel b). The blue line indicates the disk midplane (defined to be at 30.75°) while the green line shows the orientation of the inner disk, as found in dust disk observations.
This figure is made of several images, please see below:
Current usage metrics show cumulative count of Article Views (full-text article views including HTML views, PDF and ePub downloads, according to the available data) and Abstracts Views on Vision4Press platform.
Data correspond to usage on the plateform after 2015. The current usage metrics is available 48-96 hours after online publication and is updated daily on week days.
Initial download of the metrics may take a while.