Free Access
Fig. 3
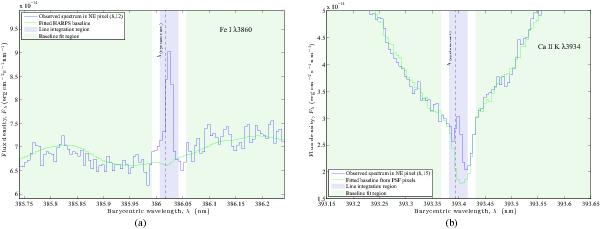
Example spectra of Fe i 3860 a) and Ca ii K b), both sampled from the NE side of the disk. The regions used for baseline fitting and line integration are indicated, as is the systemic rest velocity of β Pic (dashed vertical line).
This figure is made of several images, please see below:
Current usage metrics show cumulative count of Article Views (full-text article views including HTML views, PDF and ePub downloads, according to the available data) and Abstracts Views on Vision4Press platform.
Data correspond to usage on the plateform after 2015. The current usage metrics is available 48-96 hours after online publication and is updated daily on week days.
Initial download of the metrics may take a while.