Fig. 1
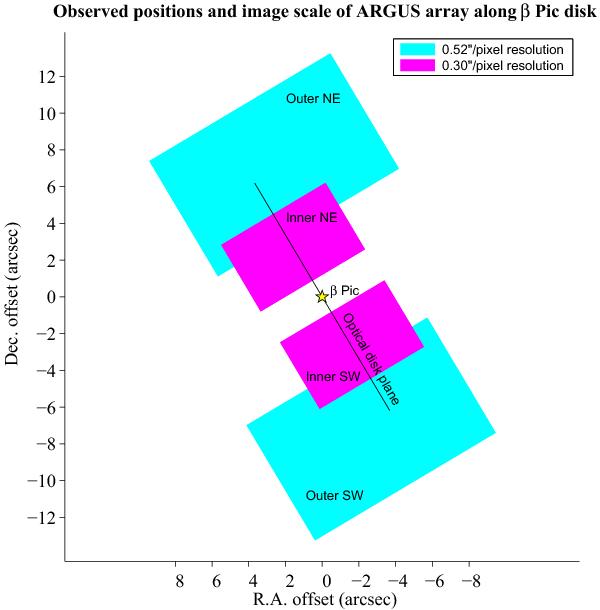
Scale and position in the sky of the ARGUS array during the observations. The northeast (NE) and southwest (SW) side of the optical disk plane (marked with a black line) was covered, omitting the area closest to the star, where the stellar PSF and scattered light would be strong, giving low signal-to-noise ratio. Cyan- and magenta-coloured areas represent the higher (0.30″/pixel) and lower (0.52″/pixel) spatial resolution settings used for the inner and outer disk, respectively.
Current usage metrics show cumulative count of Article Views (full-text article views including HTML views, PDF and ePub downloads, according to the available data) and Abstracts Views on Vision4Press platform.
Data correspond to usage on the plateform after 2015. The current usage metrics is available 48-96 hours after online publication and is updated daily on week days.
Initial download of the metrics may take a while.