Fig. A.1
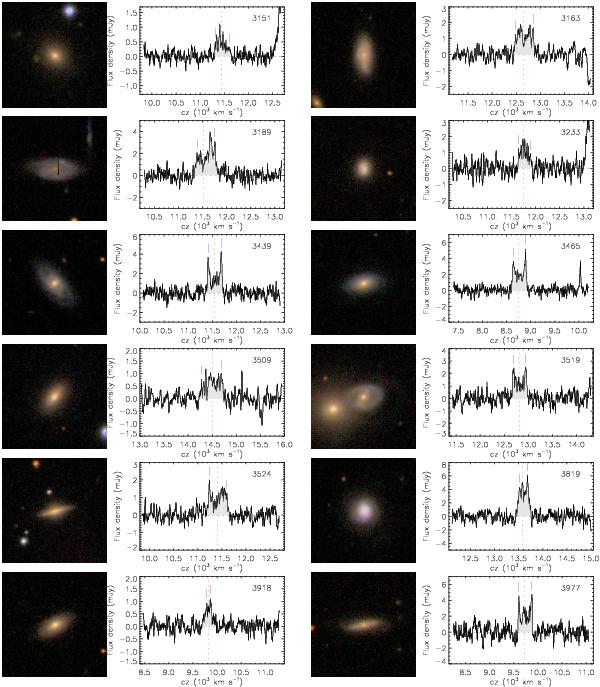
SDSS postage stamp images (1 arcmin square) and Hi-line profiles of the detections included in this second data release, ordered by increasing GASS number (indicated in each spectrum). The Hi spectra are calibrated, smoothed and baseline-subtracted. A dotted line and two dashes indicate the heliocentric velocity corresponding to the SDSS redshift and the two peaks used for width measurement, respectively.
Current usage metrics show cumulative count of Article Views (full-text article views including HTML views, PDF and ePub downloads, according to the available data) and Abstracts Views on Vision4Press platform.
Data correspond to usage on the plateform after 2015. The current usage metrics is available 48-96 hours after online publication and is updated daily on week days.
Initial download of the metrics may take a while.