Fig. 7
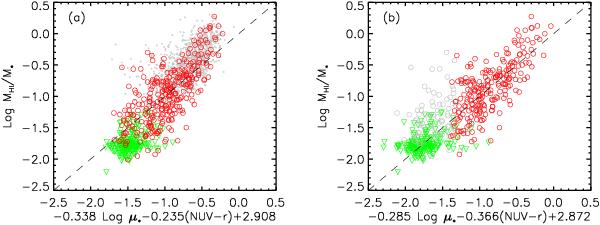
Gas fraction plane, a relation between Hi mass fraction and a linear combination of stellar mass surface density and observed NUV − r color. a) Relation obtained using all the Hi detections in the GASS representative sample (red circles). The symbols are the same as those in Fig. 5. b) Relation obtained using only the subset of detected galaxies with NUV − r ≤ 4.5 mag (red circles). Gray circles and green upside-down triangles indicate the remaining Hi detections and the non-detections, respectively.
Current usage metrics show cumulative count of Article Views (full-text article views including HTML views, PDF and ePub downloads, according to the available data) and Abstracts Views on Vision4Press platform.
Data correspond to usage on the plateform after 2015. The current usage metrics is available 48-96 hours after online publication and is updated daily on week days.
Initial download of the metrics may take a while.