Fig. 5
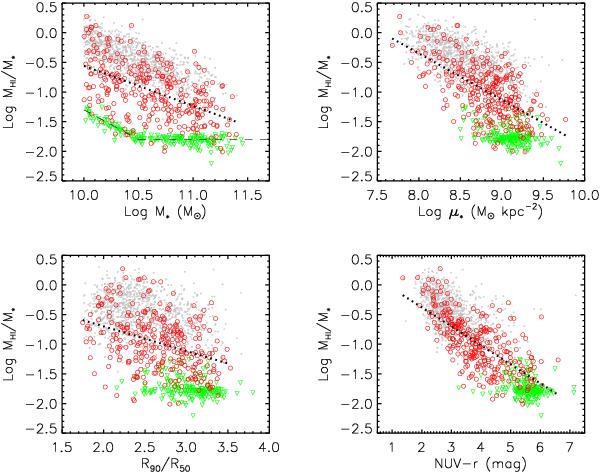
The Hi mass fraction of the GASS sample is plotted here as a function of stellar mass, stellar mass surface density, concentration index, and observed NUV − r color. Red circles and green triangles represent detections and non-detections, respectively. For comparison, we also show the full set of ALFALFA galaxies meeting the GASS selection criteria that have been cataloged to date (gray). The dashed line on the top-left panel indicates the Hi detection limit of GASS. Dotted lines in each panel are linear fits to the Hi detections only.
Current usage metrics show cumulative count of Article Views (full-text article views including HTML views, PDF and ePub downloads, according to the available data) and Abstracts Views on Vision4Press platform.
Data correspond to usage on the plateform after 2015. The current usage metrics is available 48-96 hours after online publication and is updated daily on week days.
Initial download of the metrics may take a while.