Fig. 3
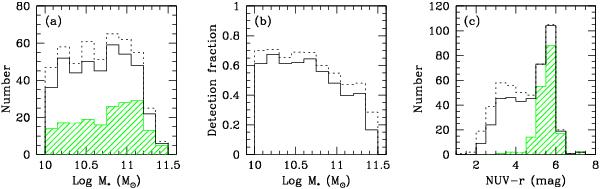
Stellar mass a) and observed NUV − r color c) distributions for the GASS observed sample (solid). Hatched histograms indicate the corresponding distributions for the non-detections. The detection fraction (i.e., the ratio of detections to total) is shown as a function of stellar mass in b). The dotted histograms in all panels show the distributions for the representative sample (see text).
Current usage metrics show cumulative count of Article Views (full-text article views including HTML views, PDF and ePub downloads, according to the available data) and Abstracts Views on Vision4Press platform.
Data correspond to usage on the plateform after 2015. The current usage metrics is available 48-96 hours after online publication and is updated daily on week days.
Initial download of the metrics may take a while.