Fig. 2
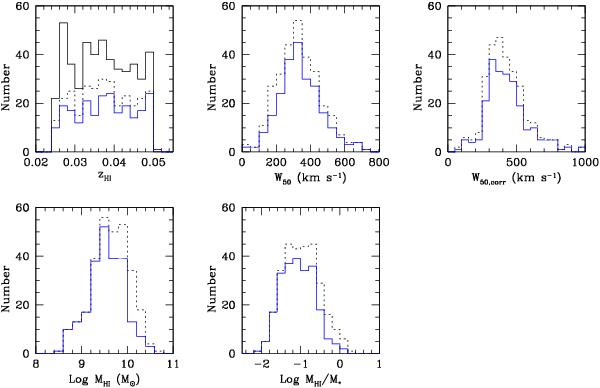
Distributions of redshifts, velocity widths, velocity widths corrected for inclination, Hi masses and gas mass fractions for the galaxies with Hi detections from GASS (blue histograms, 232 galaxies). Dotted histograms correspond to the representative sample, which includes gas-rich objects from ALFALFA and/or S05 archive (see text). The solid black histogram in the top left panel shows the distribution of SDSS redshifts for the full sample (i.e. including the non-detections).
Current usage metrics show cumulative count of Article Views (full-text article views including HTML views, PDF and ePub downloads, according to the available data) and Abstracts Views on Vision4Press platform.
Data correspond to usage on the plateform after 2015. The current usage metrics is available 48-96 hours after online publication and is updated daily on week days.
Initial download of the metrics may take a while.