Fig. 4
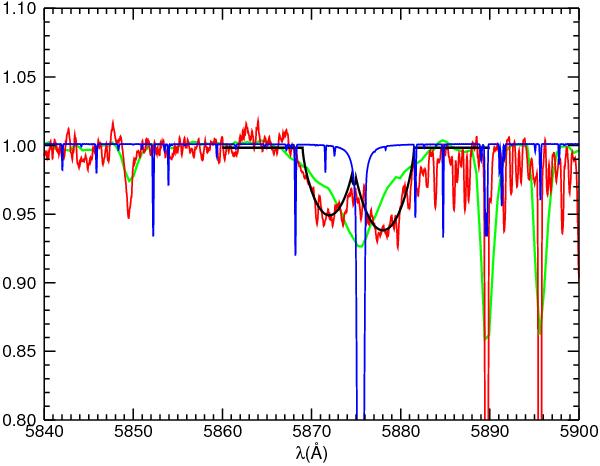
The high resolution FIES spectrum (red) of the region around the He i 5875.62 Å line is compared to the intermediate resolution spectrum (green) from 12 years before. The He i line shape has changed dramatically. The blue spectrum represents a synthetic spectrum from an ATLAS model (Teff = 15 000 K). The two U-shaped components represent two velocity shifted, rotating B5 stars.
Current usage metrics show cumulative count of Article Views (full-text article views including HTML views, PDF and ePub downloads, according to the available data) and Abstracts Views on Vision4Press platform.
Data correspond to usage on the plateform after 2015. The current usage metrics is available 48-96 hours after online publication and is updated daily on week days.
Initial download of the metrics may take a while.