Free Access
Fig. 11
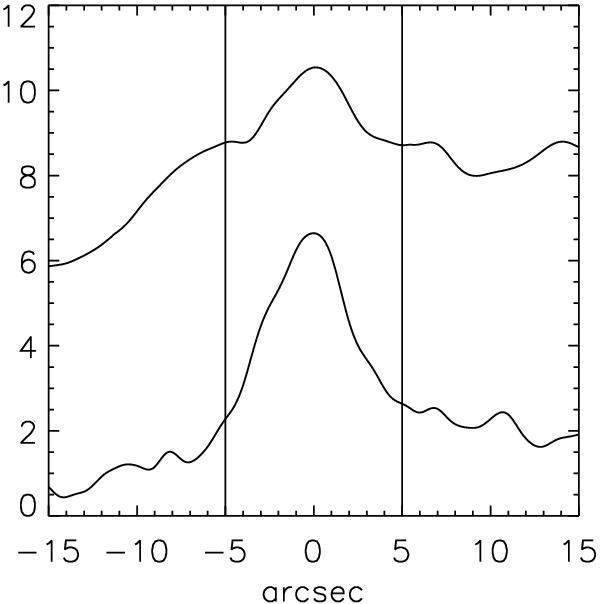
A cut perpendicular to the disk-like feature as observed in the V band. The upper curve represents the Stokes I and the lower curve 5 × Ppwr. One unit on the y scale corresponds to 22.8 mag per square arcsecond. The two vertical lines mark the positions where we define the brightness of the background nebula.
Current usage metrics show cumulative count of Article Views (full-text article views including HTML views, PDF and ePub downloads, according to the available data) and Abstracts Views on Vision4Press platform.
Data correspond to usage on the plateform after 2015. The current usage metrics is available 48-96 hours after online publication and is updated daily on week days.
Initial download of the metrics may take a while.