Fig. 9
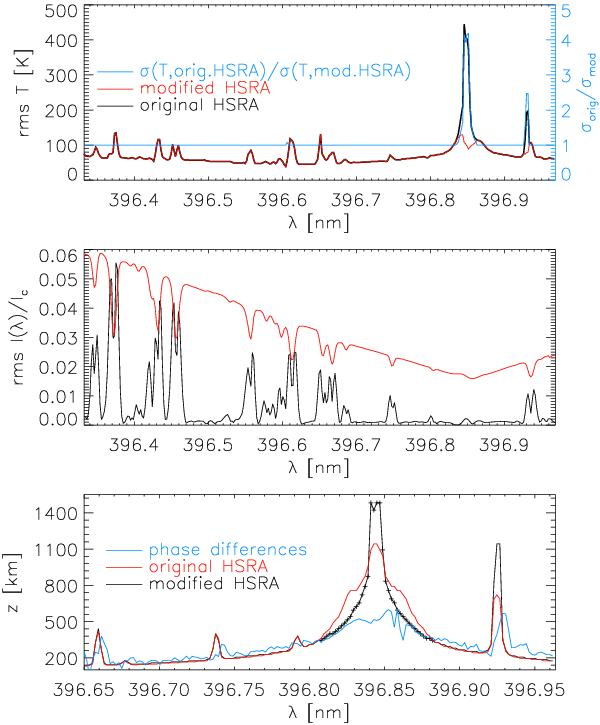
Derivation of error estimates for Ca ii H. Bottom: formation heights in the original (red) and modified HSRA model (black). The blue line gives the formation height from phase differences. Middle: rms fluctuations induced by random Doppler shifts (black). The red line shows an average profile. Top: temperature rms using the original (black) and modified HSRA model (red). Their ratio is given by the blue line with the axis on the right-hand side.
Current usage metrics show cumulative count of Article Views (full-text article views including HTML views, PDF and ePub downloads, according to the available data) and Abstracts Views on Vision4Press platform.
Data correspond to usage on the plateform after 2015. The current usage metrics is available 48-96 hours after online publication and is updated daily on week days.
Initial download of the metrics may take a while.