Fig. 7
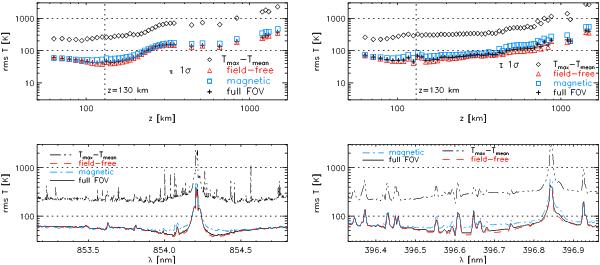
Rms fluctuations of brightness temperature vs. wavelength (bottom row) and geometrical height (top row). Left column: Ca ii IR at 854 nm. Right column: Ca ii H at 396 nm. The difference of maximum and average temperature is overplotted with a black-dashed triple-dotted line and black diamonds, respectively. Other labels and notation are as in Fig. 5.
Current usage metrics show cumulative count of Article Views (full-text article views including HTML views, PDF and ePub downloads, according to the available data) and Abstracts Views on Vision4Press platform.
Data correspond to usage on the plateform after 2015. The current usage metrics is available 48-96 hours after online publication and is updated daily on week days.
Initial download of the metrics may take a while.