Fig. 5
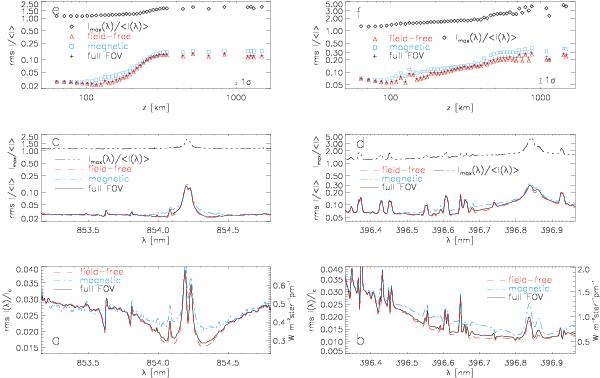
Absolute (bottom row) and relative (middle row) rms variation in the intensity as a function of wavelength for Ca ii IR at 854 nm (left) and Ca ii H (right). The solid black lines denote the full FOV, and the red dashed and blue dash-dotted lines the field-free and magnetic locations, respectively. Top row: relative fluctuations versus (vs.) geometrical height. Black crosses: full FOV. Blue squares: magnetic locations. Red triangles: field-free locations. The ratio of maximum to average intensity is overplotted in the upper two rows with a black dashed triple-dotted line and black diamonds, respectively. The short bars in the lower right corners in panels e and f indicate the average range of scatter in the plotted data points.
Current usage metrics show cumulative count of Article Views (full-text article views including HTML views, PDF and ePub downloads, according to the available data) and Abstracts Views on Vision4Press platform.
Data correspond to usage on the plateform after 2015. The current usage metrics is available 48-96 hours after online publication and is updated daily on week days.
Initial download of the metrics may take a while.