Fig. 3
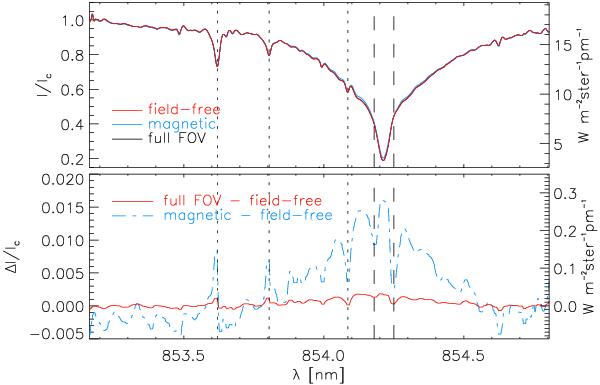
Average profiles of Ca ii IR at 854 nm. Top: average profiles of the full FOV (black), field-free (red), and magnetic locations (blue). Bottom: difference between the profiles of the full FOV and the field-free locations (red solid) and difference between magnetic and field-free locations (blue dash-dotted). The dotted vertical lines denote the locations of line blends, and the dashed vertical lines illustrate an asymmetry in the intensity differences.
Current usage metrics show cumulative count of Article Views (full-text article views including HTML views, PDF and ePub downloads, according to the available data) and Abstracts Views on Vision4Press platform.
Data correspond to usage on the plateform after 2015. The current usage metrics is available 48-96 hours after online publication and is updated daily on week days.
Initial download of the metrics may take a while.