Fig. 1
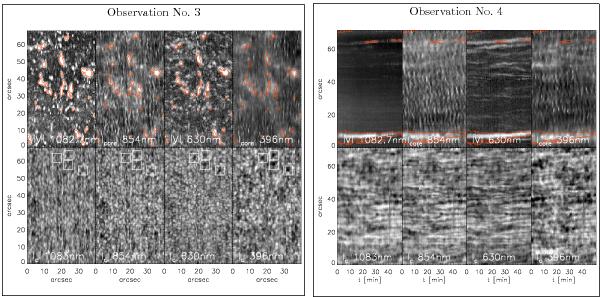
Overview maps of the observation No. 3 (left panel) and No. 4 (right panel). Bottom row, left to right: continuum intensity at 1083 nm, 854 nm, 630 nm, and 396 nm. Top row, left to right: unsigned wavelength-integrated Stokes V signal around Si i at 1082.7 nm, line-core intensity of the Ca ii IR line at 854.2 nm, unsigned wavelength-integrated Stokes V signal around 630 nm, and line-core intensity of Ca ii H at 396.85 nm. The red contours outline strong polarisation signals. The white squares denote co-spatial local darkenings.
Current usage metrics show cumulative count of Article Views (full-text article views including HTML views, PDF and ePub downloads, according to the available data) and Abstracts Views on Vision4Press platform.
Data correspond to usage on the plateform after 2015. The current usage metrics is available 48-96 hours after online publication and is updated daily on week days.
Initial download of the metrics may take a while.