Fig. 9
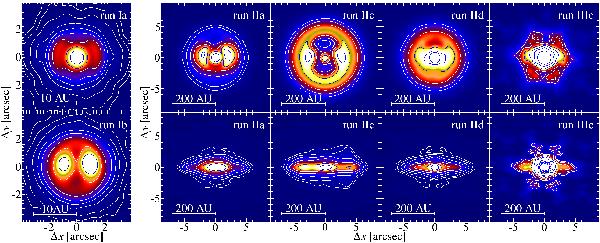
JWST/MIRI images at 25.5 μm. Leftmost column: images produced from the runs Ia and Ib. The ϵ Eri inner debris disk is used as reference. Columns two to five: images produced from the runs IIa, IIc, IId, and IIIc. The HD 107146 debris disk is used as reference. The contours in each image represent 3σ, 5σ, 10σ, 20σ, etc. (double every step) S/N levels for a total integration time of 10 s (ϵ Eri) and 900 s (HD 107146). The images are shown in a logarithmic stretch.
Current usage metrics show cumulative count of Article Views (full-text article views including HTML views, PDF and ePub downloads, according to the available data) and Abstracts Views on Vision4Press platform.
Data correspond to usage on the plateform after 2015. The current usage metrics is available 48-96 hours after online publication and is updated daily on week days.
Initial download of the metrics may take a while.