Free Access
Fig. 8
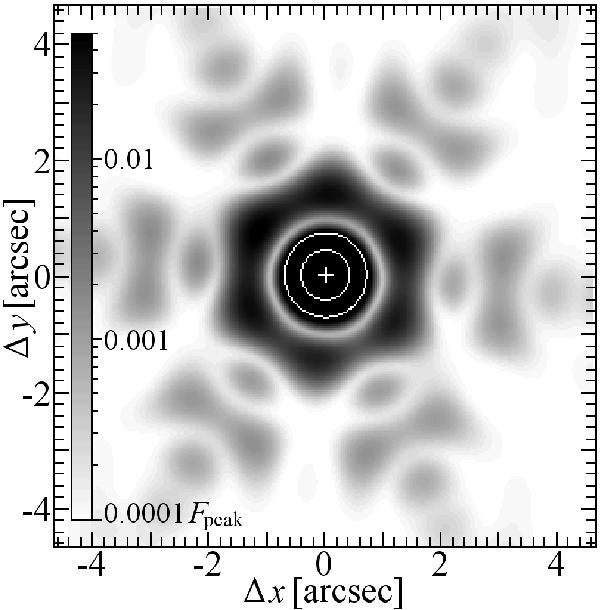
Simulated PSF of JWST/MIRI at 25.5 μm. The image is shown in a logarithmic stretch from 0 to 5% of the peak flux to highlight the high order structure. The white contours represent 10% and 50% of the peak flux.
Current usage metrics show cumulative count of Article Views (full-text article views including HTML views, PDF and ePub downloads, according to the available data) and Abstracts Views on Vision4Press platform.
Data correspond to usage on the plateform after 2015. The current usage metrics is available 48-96 hours after online publication and is updated daily on week days.
Initial download of the metrics may take a while.