Fig. 6
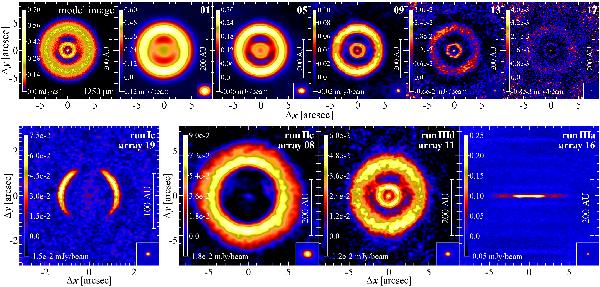
Top: simulated ALMA observations of the model image resulting from run IIId (face-on orientation) for different array configurations. Only the results from a representative number of array configurations are shown. The number in the upper-right corner of each image denotes the array number. The corresponding beam is displayed in the lower-right corner of each image. Bottom: simulated ALMA observations of all selected model images. The optimum array configurations have been selected. The run and the array number are displayed in the upper-right corner, the corresponding beam is displayed in the lower-right corner of each image. All observations were simulated for Band 6 (central wavelength 1250 μm).
Current usage metrics show cumulative count of Article Views (full-text article views including HTML views, PDF and ePub downloads, according to the available data) and Abstracts Views on Vision4Press platform.
Data correspond to usage on the plateform after 2015. The current usage metrics is available 48-96 hours after online publication and is updated daily on week days.
Initial download of the metrics may take a while.