Fig. 5
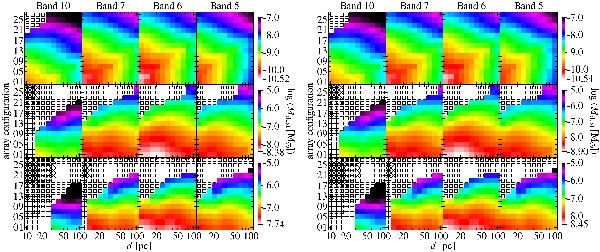
Maps of the 10σ sensitivity of ALMA to face-on seen (left) and edge-on seen (right) debris disks as a function of the distance and array configuration (spatial resolution) for different wavelengths of observations. The three rows refer to different disk extents given by rin of 5 AU (top), 50 AU (middle), and 100 AU (bottom). Disk mass can be converted into fractional luminosity following Eq. (3). For details about the model images and about the simulation of observations see Sects. 4.1.1 and 4.1.2. The detectable disk mass is color-coded and can be converted into fractional luminosity following Eq. (3). White pixels with symbols mark positions where the simulations failed or observations are impossible for various reasons denoted by the symbols as follows (see Sect. 4.1.3 for more details): cross – the spatial extent of the disk is larger than the field of view of a single pointing, × – the disk is “resolved out” (the radial width of the ring is larger than the largest scale detectable), open square – artifacts of the image reconstruction caused by deficiencies of the model image dominate the simulated observations.
Current usage metrics show cumulative count of Article Views (full-text article views including HTML views, PDF and ePub downloads, according to the available data) and Abstracts Views on Vision4Press platform.
Data correspond to usage on the plateform after 2015. The current usage metrics is available 48-96 hours after online publication and is updated daily on week days.
Initial download of the metrics may take a while.