Fig. 4
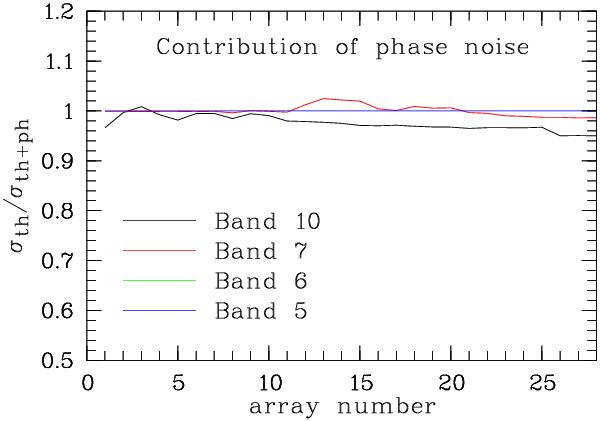
Contribution of phase noise to the total noise in our ALMA observations (Ruge, priv. comm.). The noise levels are computed as the standard deviation of all pixels in simulated observations of empty images (all pixels set to 0.0). The quantity σth represents the standard deviation in simulations with only thermal noise considered, while σth + ph is derived from simulations considering thermal and phase noise. Ratios higher than 1.0 may occur because of uncertainties in noise estimates and because of different noise contributions that in part cancel out each other. The curves for Band 5 and Band 6 are very close to 1.0 and cannot be distinguished in the plot. In any case, the contribution of phase noise is lower than 5%.
Current usage metrics show cumulative count of Article Views (full-text article views including HTML views, PDF and ePub downloads, according to the available data) and Abstracts Views on Vision4Press platform.
Data correspond to usage on the plateform after 2015. The current usage metrics is available 48-96 hours after online publication and is updated daily on week days.
Initial download of the metrics may take a while.