Fig. 3
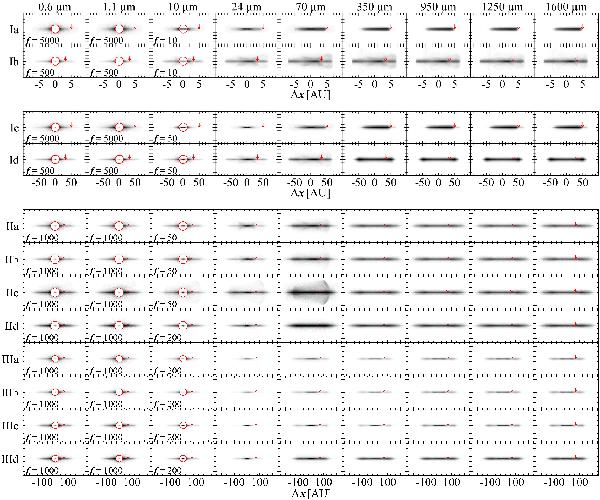
Same as Figs. 1 and 2, but for an edge-on orientation of the disk. The position of the planet is indicated by the red arrow in each image. The flux is given in arbitrary units and displayed in a logarithmic stretch from zero to peak value for model sequence I, from zero to 1/2 of the peak value at wavelengths up to 24 μm for model sequence II and III, and at longer wavelengths form zero to 1/2 of the peak value for model sequence II and to the peak value for model sequence III. Note that a disk without a planet would show a smooth, featureless radial surface brightness distribution (besides the possible signpost of inner and outer disk radius).
Current usage metrics show cumulative count of Article Views (full-text article views including HTML views, PDF and ePub downloads, according to the available data) and Abstracts Views on Vision4Press platform.
Data correspond to usage on the plateform after 2015. The current usage metrics is available 48-96 hours after online publication and is updated daily on week days.
Initial download of the metrics may take a while.