Fig. 1
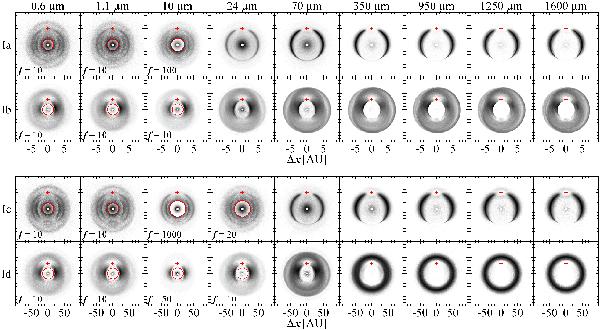
Simulated images from model sequence I for a face-on orientation of the disk at different wavelengths. The wavelength is indicated at the top of each column. The star is at the center of each image. The position of the planet is indicated by the red cross in each image. The flux is given in arbitrary units and displayed in a logarithmic stretch from zero to peak value. The region marked by a red circle in some images has been attenuated by a factor f to properly display the dynamical range of the images. The value of f is then indicated in the lower-left corner of each image. If no value of f is given, no attenuation has been applied. Note that a disk without a planet would show no azimuthal structures, but a smooth, featureless radial surface brightness distribution (besides inner and outer disk radius).
Current usage metrics show cumulative count of Article Views (full-text article views including HTML views, PDF and ePub downloads, according to the available data) and Abstracts Views on Vision4Press platform.
Data correspond to usage on the plateform after 2015. The current usage metrics is available 48-96 hours after online publication and is updated daily on week days.
Initial download of the metrics may take a while.