Fig. 12
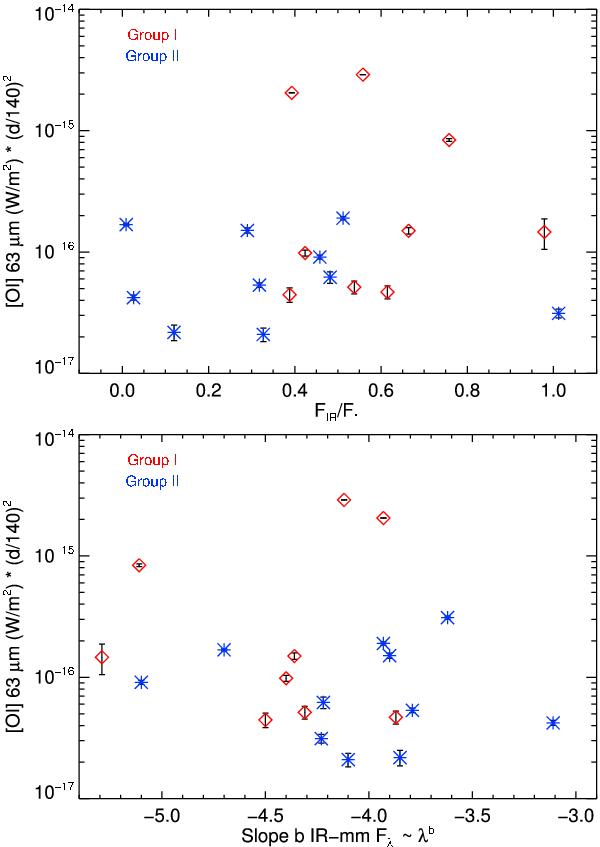
Top: [O i] 63 μm line flux versus amount of IR excess. We find no correlation between these variables. The two objects to the left are HD 141569A and 51 Oph, a transitional and a compact disc, respectively. Bottom: [O i] 63 μm line flux versus the slope b of the SED at far-IR to mm wavelengths. The line flux also does not correlate with the SED slope. Diamonds are group I sources, asterisks are group II sources.
Current usage metrics show cumulative count of Article Views (full-text article views including HTML views, PDF and ePub downloads, according to the available data) and Abstracts Views on Vision4Press platform.
Data correspond to usage on the plateform after 2015. The current usage metrics is available 48-96 hours after online publication and is updated daily on week days.
Initial download of the metrics may take a while.