Free Access
Fig. 11
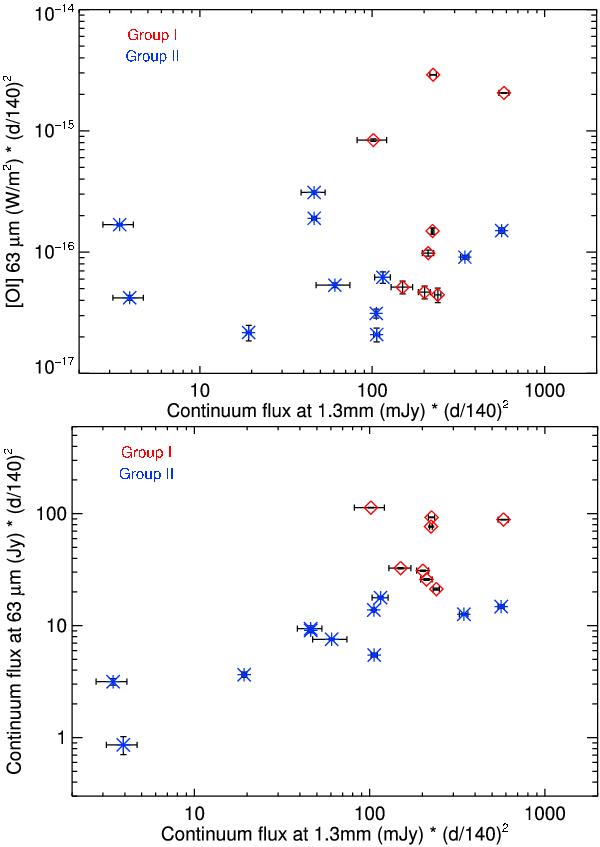
Top: [O i] 63 μm versus the continuum flux at 1.3 mm; there is a weak trend of stronger line flux with higher continuum flux. Bottom: the continuum flux at 63 μm versus the continuum flux at 1.3 mm, where we see a strong correlation. Diamonds are group I sources, asterisks are group II sources.
This figure is made of several images, please see below:
Current usage metrics show cumulative count of Article Views (full-text article views including HTML views, PDF and ePub downloads, according to the available data) and Abstracts Views on Vision4Press platform.
Data correspond to usage on the plateform after 2015. The current usage metrics is available 48-96 hours after online publication and is updated daily on week days.
Initial download of the metrics may take a while.