Free Access
Fig. 7
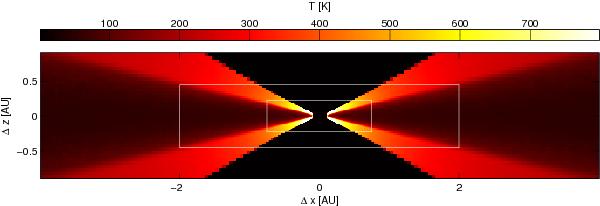
Temperature distribution in the xz-midplane of the circumstellar disc model. The figure shows an 8 AU × 1.8 AU part at the centre of the 800 × 800 × 240 AU model. The boxes indicate the boundaries of subgrids.
Current usage metrics show cumulative count of Article Views (full-text article views including HTML views, PDF and ePub downloads, according to the available data) and Abstracts Views on Vision4Press platform.
Data correspond to usage on the plateform after 2015. The current usage metrics is available 48-96 hours after online publication and is updated daily on week days.
Initial download of the metrics may take a while.