Fig. 5
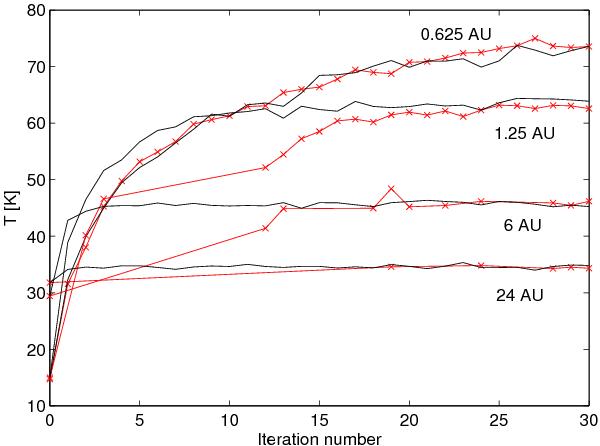
Convergence of the temperature at cells near the xy-midplane of the disc model. The red line shows the results from the subiteration algorithm, and the crosses indicate the iterations where each grid was updated. The results of the full iterations, where all grids were updated at each iteration, are shown with the black lines without markers. The cells are approximately 0.625 AU, 1.25 AU, 6 AU, and 24 AU from the central star.
Current usage metrics show cumulative count of Article Views (full-text article views including HTML views, PDF and ePub downloads, according to the available data) and Abstracts Views on Vision4Press platform.
Data correspond to usage on the plateform after 2015. The current usage metrics is available 48-96 hours after online publication and is updated daily on week days.
Initial download of the metrics may take a while.