Free Access
Fig. 3
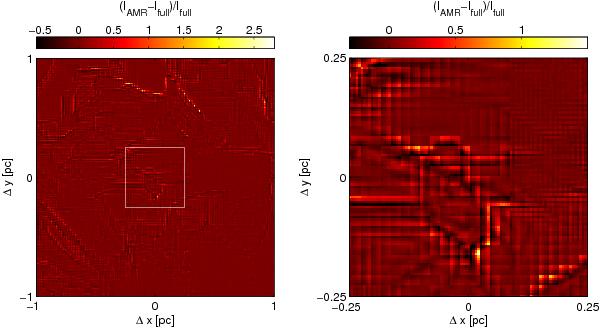
The left panel shows the relative difference of the molecular cloud’s 100 μm surface brightness between the full-resolution model and the hierarchial model. The right panel shows an enlarged view of the region marked with the white box.
Current usage metrics show cumulative count of Article Views (full-text article views including HTML views, PDF and ePub downloads, according to the available data) and Abstracts Views on Vision4Press platform.
Data correspond to usage on the plateform after 2015. The current usage metrics is available 48-96 hours after online publication and is updated daily on week days.
Initial download of the metrics may take a while.