Fig. 8
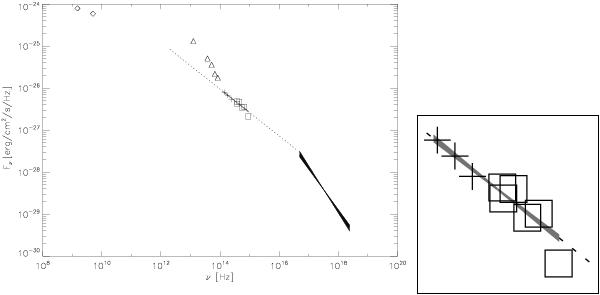
SED of the PSR B0540−69 PWN with our NACO JHKS fluxes (crosses), the HST optical fluxes (rectangles) obtained from the data of Mignani et al. (2010), the Spitzer IRAC and MIPS fluxes (triangles) of Williams et al. (2008), and the radio fluxes (diamonds) from Manchester et al. (1993). The Chandra PL fit to the X-ray spectrum of the PWN (Kaaret et al. 2001) is shown as a black bow-tie. The PL fit to the IR and optical data is shown as a dark grey bow-tie (see zoom on the right panel). The dotted line shows the extrapolation of the optical/nIR spectrum towards the X-ray and the mIR.
Current usage metrics show cumulative count of Article Views (full-text article views including HTML views, PDF and ePub downloads, according to the available data) and Abstracts Views on Vision4Press platform.
Data correspond to usage on the plateform after 2015. The current usage metrics is available 48-96 hours after online publication and is updated daily on week days.
Initial download of the metrics may take a while.