Fig. 3
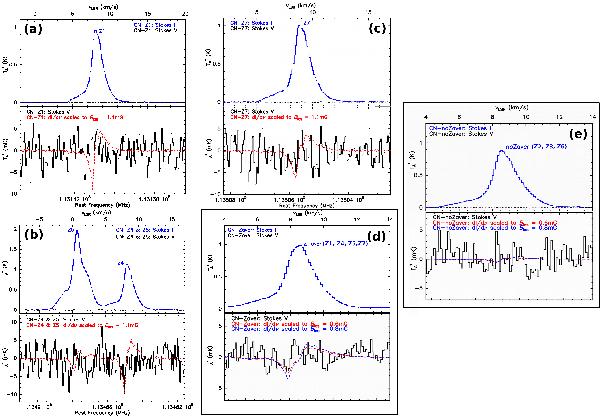
a)–c) panels show the Stokes I (top panel) and Stokes V (bottom panel) cumulative spectra obtained for each of the Zeeman-sensitive CN(1–0) hyperfine components: component Z1 in a), components Z4 and Z5 in b), and component Z7 in c). Overplotted on each Stokes V spectrum is the measurement of dI/dν computed from the Stokes I spectrum, and scaled to the upper-limit magnetic field Blos ~ 1.1 mG that can fit to each individual hyperfine Stokes V spectrum. The typical rms noise level in these spectra is ~2.5 mK. Panel d) shows the average Stokes I (top) and Stokes V (bottom) spectra, using the four components that are most sensitive to the Zeeman effect (Z1, Z4, Z5, and Z7) weighted by their respective Zeeman sensitivity. The dashed colored lines overplotted in the lower panel show the dI/dν computed from the average Stokes I spectrum and scaled to match the 3-σ rms noise level in the Stokes V spectrum. The rms noise level in the average Stokes V spectrum is  mK, leading to an upper limit on the magnetic field strength along the line of sight of Blos ≲ 0.6 mG. The rightmost panel e) shows the average Stokes I (top) and Stokes V (bottom) spectra, using the three components least sensitive to the Zeeman effect (Z2, Z3 and Z6) weighted by their respective Zeeman sensitivity. These components are mainly sensitive to the effects of instrumental polarization, and their spectra do not contain any significant feature.
Current usage metrics show cumulative count of Article Views (full-text article views including HTML views, PDF and ePub downloads, according to the available data) and Abstracts Views on Vision4Press platform.
Data correspond to usage on the plateform after 2015. The current usage metrics is available 48-96 hours after online publication and is updated daily on week days.
Initial download of the metrics may take a while.