Fig. 1
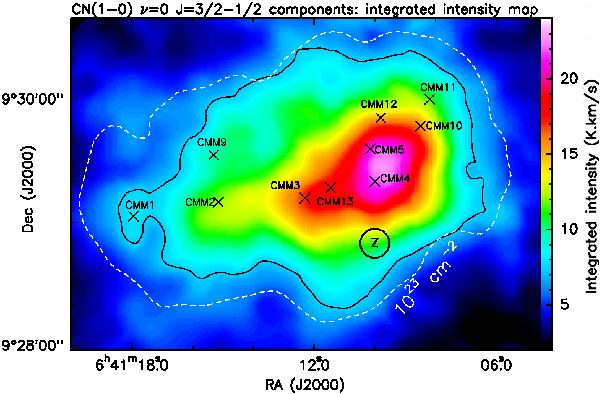
Integrated intensity map of the CN (N = 1 − 0,J = 3/2 − 1/2) hyperfine components, obtained with EMIR in May 2009. The black contour represents the 3-σ integrated intensity level (7.3 K km s-1) in the map. The crosses show the location of the millimeter dense cores mapped with MAMBO on the IRAM-30 m by Peretto et al. (2006). The white dashed contour shows the value of column density ~1 × 1023 cm-2, inferred from the MAMBO and P-ArTéMiS continuum maps (Maury et al. 2009). The circle shows the location “Z” where we carried out further polarimetric observations to probe the Zeeman effect.
Current usage metrics show cumulative count of Article Views (full-text article views including HTML views, PDF and ePub downloads, according to the available data) and Abstracts Views on Vision4Press platform.
Data correspond to usage on the plateform after 2015. The current usage metrics is available 48-96 hours after online publication and is updated daily on week days.
Initial download of the metrics may take a while.