Fig. 6
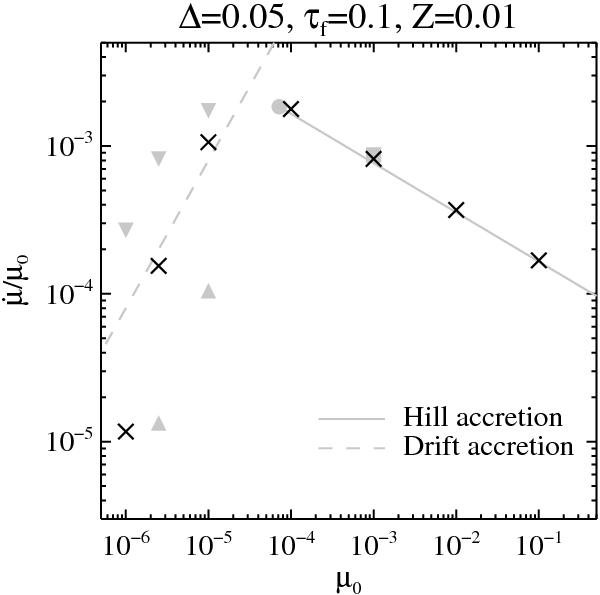
Accretion rate  as function of the initial core mass μ0. Theoretical curves for the branches corresponding to drift and Hill accretion are plotted as respectively dashed and full lines in grey. The grey full circle marks the transition mass. Black crosses represent the simulated results in a stratified shearing sheet, with Δ = 0.05. Triangles correspond to simulations with modified Δ, a grey upwards pointing triangle corresponds to Δ = 0.07 and a downwards pointing triangle corresponds to Δ = 0.03. In the Hill branch, the position of both triangles lie on top of the black crosses and are omitted for clarity. The grey square shows the result of simulation 1e-3_0.1_b, which includes the particle backreaction.
Current usage metrics show cumulative count of Article Views (full-text article views including HTML views, PDF and ePub downloads, according to the available data) and Abstracts Views on Vision4Press platform.
Data correspond to usage on the plateform after 2015. The current usage metrics is available 48-96 hours after online publication and is updated daily on week days.
Initial download of the metrics may take a while.