Fig. 5
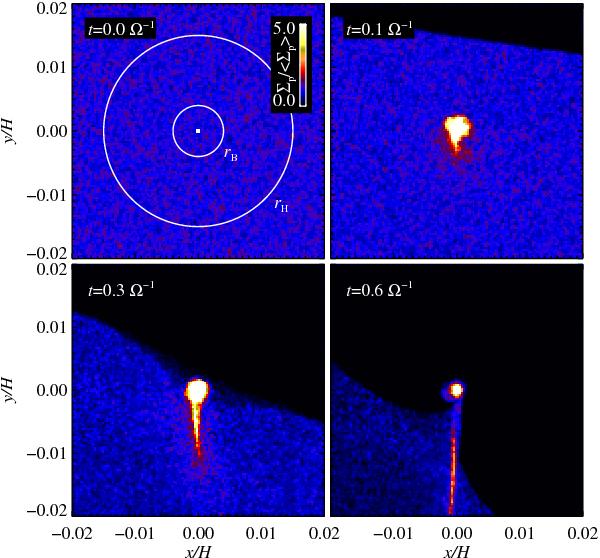
Accretion of pebbles with τf = 0.1 by the central core (μc = 10-5) in the drift regime. The colour coding shows the local particle surface density Σp, normalised by the average particle density  , in the simulated shearing box with Z = Hp/H = 0.01. Marked as a white dot, the central seed core can be seen in the first panel. Both the drift and Hill radii are plotted as white circles. The second panel illustrates the drift of the particles (Δ = 0.05) and creation of an accreting particle wake. In the third panel, particles within the drift radius rd ≈ rB are accreted. Particles further out may be carried out of the box by the sub-Keplerian gas or by the Keplerian shear. In the final panel the headwind has blown most pebbles past the core, with only a minority accreted.
Current usage metrics show cumulative count of Article Views (full-text article views including HTML views, PDF and ePub downloads, according to the available data) and Abstracts Views on Vision4Press platform.
Data correspond to usage on the plateform after 2015. The current usage metrics is available 48-96 hours after online publication and is updated daily on week days.
Initial download of the metrics may take a while.