Fig. 11
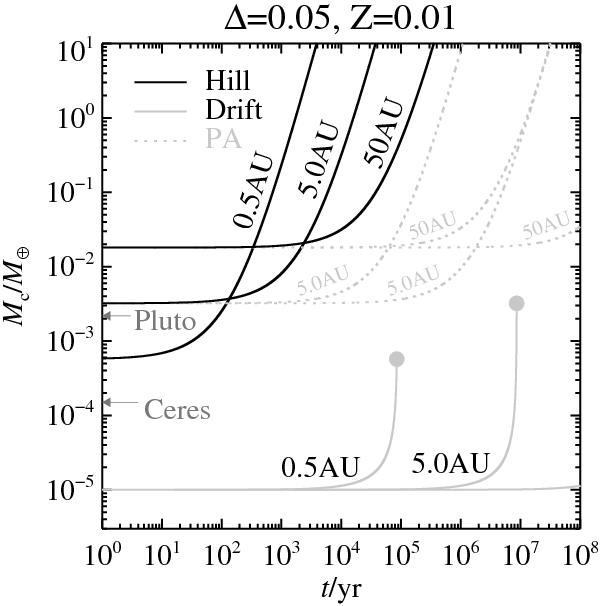
Core growth as function of time, plotted for various orbital distances (0.5,5 and 50 AU). The drift branch, marked by grey solid lines, assumes an initial core mass of M0 = 10-5M⊕ and Δ = 0.05. The drift growth continues until the transition mass Mt is reached (marked by a full grey dot). Accretion continues through the more efficient Hill branch, drawn in black. For clarity, we start the Hill growth from the transition mass at time t = 0 yr, instead of continuing from the time where drift accretion comes to a halt. The masses of Ceres and Pluto (located at respectively 2.7 and 39 AU) are marked on the vertical axis for reference. The grey dotted curves correspond to classical planetesimal accretion (PA), where the faster growth corresponds to 2D accretion of planetesimal fragments (Rafikov 2004) and the slower to 3D accretion of planetesimals (e.g. Dodson-Robinson et al. 2009). Note that drift accretion timescale at 50 AU takes more than 108 yr and its transition mass point is not plotted.
Current usage metrics show cumulative count of Article Views (full-text article views including HTML views, PDF and ePub downloads, according to the available data) and Abstracts Views on Vision4Press platform.
Data correspond to usage on the plateform after 2015. The current usage metrics is available 48-96 hours after online publication and is updated daily on week days.
Initial download of the metrics may take a while.