Fig. 5
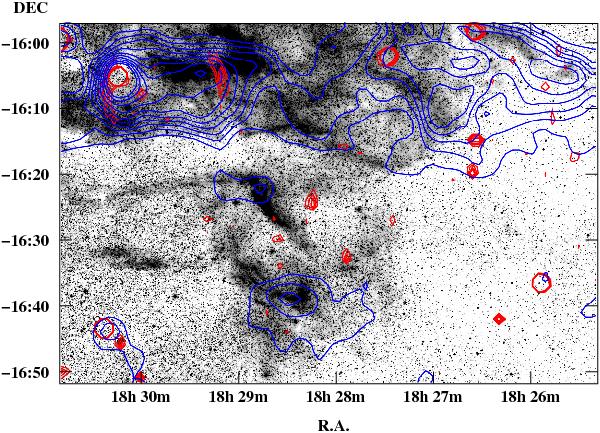
The correlation between the SuperCOSMOS Hα mosaic image and the radio emission from archival data at 4850 MHz (blue line) and 1400 MHz (red line). The blue contours scale linearly from 2.0 × 10⁻² Jy/beam to 0.2 Jy/beam, with steps of 0.02 Jy/beam and the red from 1.2 × 10⁻³ Jy/beam to 4.0 × 10⁻³ Jy/beam, with steps of 9.3 × 10⁻⁴ Jy/beam.
Current usage metrics show cumulative count of Article Views (full-text article views including HTML views, PDF and ePub downloads, according to the available data) and Abstracts Views on Vision4Press platform.
Data correspond to usage on the plateform after 2015. The current usage metrics is available 48-96 hours after online publication and is updated daily on week days.
Initial download of the metrics may take a while.