Fig. 1
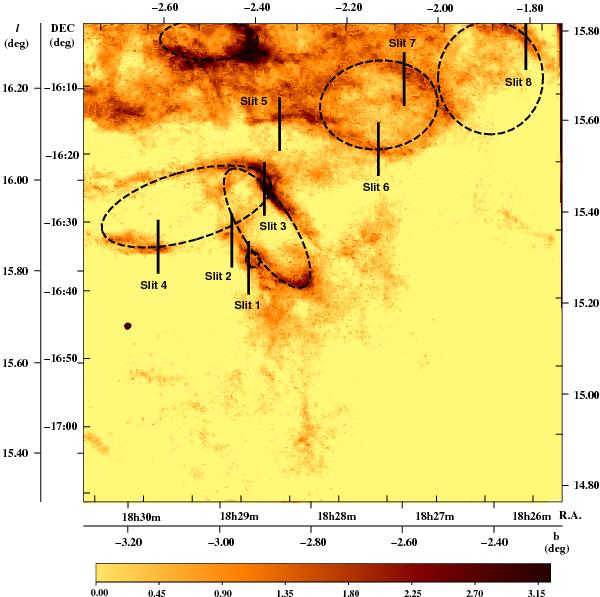
The continuum-subtracted image of the observed area in Sagittarius, in Hα + [N ii] emission in both equatorial (RA, Dec internal lines on axis) and Galactic (l, b external lines on axis) coordinates. The black lines indicate the positions of the slits and the dashed-ellipses the geometry of the newly discovered candidate SNRs. Shadings run linearly from 0 to 3.2 × 10⁻¹⁷ erg s-1 cm-2 arcsec-2.
Current usage metrics show cumulative count of Article Views (full-text article views including HTML views, PDF and ePub downloads, according to the available data) and Abstracts Views on Vision4Press platform.
Data correspond to usage on the plateform after 2015. The current usage metrics is available 48-96 hours after online publication and is updated daily on week days.
Initial download of the metrics may take a while.