Free Access
Fig. 4
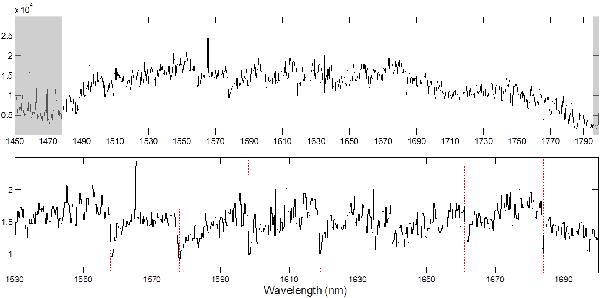
H-band spectrum of π 1 Gru (top) with grey areas indicating the parts of the spectrum contaminated with atmospheric OH absorption, and a cut showing the CO lines in more detail (bottom). The dotted red lines indicate the known wavelength of the CO (3 − 0) to (9 − 6) band-heads (Origlia et al. 1993).
Current usage metrics show cumulative count of Article Views (full-text article views including HTML views, PDF and ePub downloads, according to the available data) and Abstracts Views on Vision4Press platform.
Data correspond to usage on the plateform after 2015. The current usage metrics is available 48-96 hours after online publication and is updated daily on week days.
Initial download of the metrics may take a while.