Fig. 9
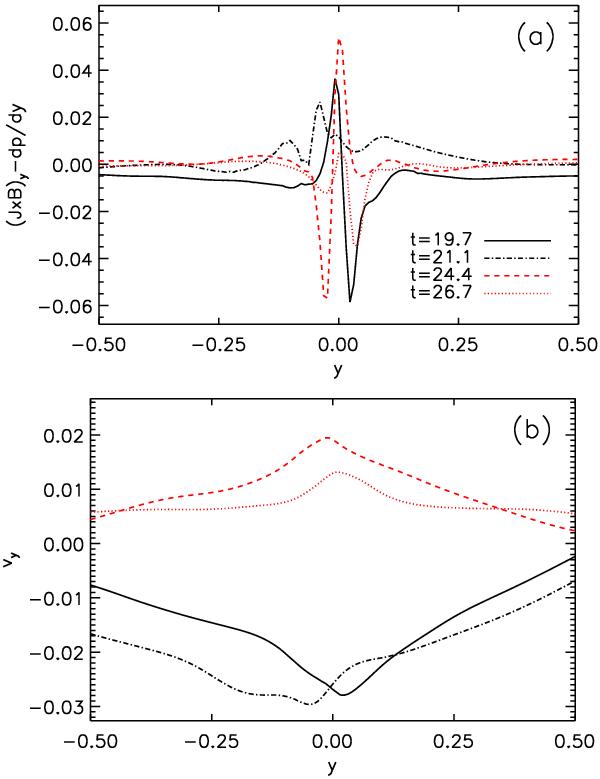
y-components of a) a summation of Lorentz and gas pressure forces and b) velocity in a cut along the y-axis at selected times; the timing of each cut is chosen for comparison with the local current configurations demonstrated in Fig. 8 (where the location of each cut is also illustrated by a dashed black line). One half of the oscillatory cycle is indicated in red, with the remaining half in black (at times indicated in the legend).
Current usage metrics show cumulative count of Article Views (full-text article views including HTML views, PDF and ePub downloads, according to the available data) and Abstracts Views on Vision4Press platform.
Data correspond to usage on the plateform after 2015. The current usage metrics is available 48-96 hours after online publication and is updated daily on week days.
Initial download of the metrics may take a while.