Fig. 8
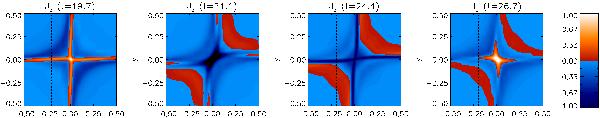
Illustration of current sheets generated during oscillatory phase. Each snapshot displays normalised perpendicular current, Jz, in a region near the X-point, x,y ∈ [ − 0.5,0.5] , at selected times during the oscillatory cycle (chosen for comparison with Fig. 9, which displays quantities along a cut indicated in each frame by a dashed black line).
Current usage metrics show cumulative count of Article Views (full-text article views including HTML views, PDF and ePub downloads, according to the available data) and Abstracts Views on Vision4Press platform.
Data correspond to usage on the plateform after 2015. The current usage metrics is available 48-96 hours after online publication and is updated daily on week days.
Initial download of the metrics may take a while.