Fig. 6
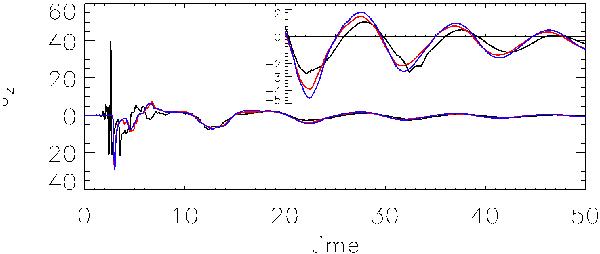
Comparison of the time evolution of the out-of-plane current, Jz, at the central null. The black line indicates the value of Jz for the central null in the λi = 0.072 simulations, overlaid with the λi = 0.0072 results (in red) and the MHD results (in blue). The insert displays the behaviour of all 3 cases at later times but over a much smaller range of Jz in the y-axis).
Current usage metrics show cumulative count of Article Views (full-text article views including HTML views, PDF and ePub downloads, according to the available data) and Abstracts Views on Vision4Press platform.
Data correspond to usage on the plateform after 2015. The current usage metrics is available 48-96 hours after online publication and is updated daily on week days.
Initial download of the metrics may take a while.