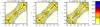
Fig. 5
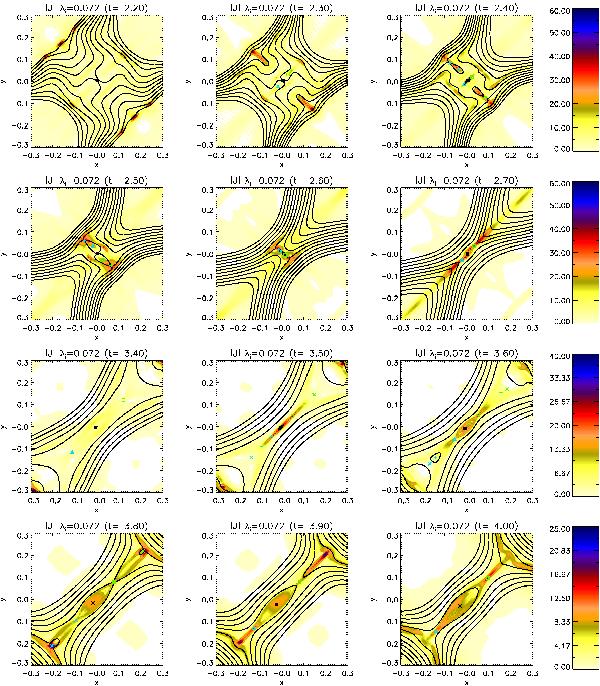
Contours of current, | J | , illustrating snapshots of the λi = 0.072 simulations, focusing closely on behaviour near the null, highlighting the presence and locations of multiple nulls, overlaid with selected contours of Az (in black). Each null is assigned a symbol and a colour based on the null position relative to the central null, which is indicated by a black star. Nulls above this along the contour of By = 0 would be seen in green and those below are shown in light blue. The distance along the By = 0 line is indicated by the symbol – a snapshot containing 7 nulls would thus display, from left to right, × + △ (in blue) ∗ (in black) □ + × (in green).
Current usage metrics show cumulative count of Article Views (full-text article views including HTML views, PDF and ePub downloads, according to the available data) and Abstracts Views on Vision4Press platform.
Data correspond to usage on the plateform after 2015. The current usage metrics is available 48-96 hours after online publication and is updated daily on week days.
Initial download of the metrics may take a while.