Fig. 3
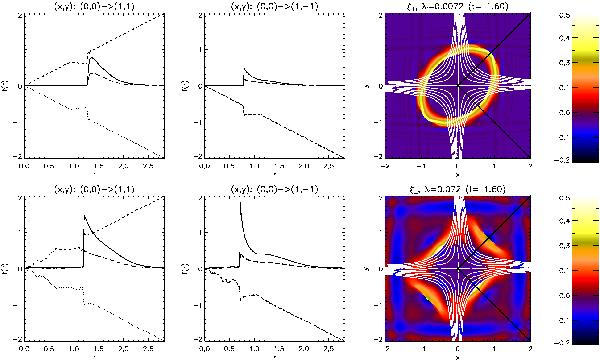
Plots illustrating the jump conditions across the shocks in the system at t = 1.6τA for different ion skin-depth values. Cuts through the shock wave front illustrate radial variations in Bx (dotted line), By (short dashes), gas pressure p (solid line) and temperature T (long dashes) for a radius 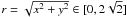 (p and T are enhanced by a factor of 50 to aid visual comparison). The positions of the cuts are indicated in the third column by the diagonal black lines, seen together with background contours of ξ ⊥ and selected contours of Az (in white).
Current usage metrics show cumulative count of Article Views (full-text article views including HTML views, PDF and ePub downloads, according to the available data) and Abstracts Views on Vision4Press platform.
Data correspond to usage on the plateform after 2015. The current usage metrics is available 48-96 hours after online publication and is updated daily on week days.
Initial download of the metrics may take a while.